You know that sinking feeling you get in the pit of your stomach when you receive your investment statement in the mailbox. You worry that it might contain disturbing news. You anxiously let the package rest on the counter wishing it would just vanish. Finally you rip the envelope open and there it is in black and white. “Statement-shock!”
Instead of that monthly statement shock, wouldn’t it be great to discover a “silver bullet” — that one piece of information that can help you improve the performance of your investment and retirement portfolios?
I’m happy to share with you that I have discovered it! In late 1999, I stumbled upon it in the most unlikely place you would expect to find such information — while working at a large full-service brokerage firm. The silver bullet for investment success is “relative strength.”
What Is Relative Strength?
Relative strength provides you a visual picture that identifies if you should own an investment and when you should own it. According to Tom Dorsey of Dorsey Wright and Associates, “Relative strength is a comparison of price trend between one stock vs. another stock or an index. I think of relative strength as an arm wrestling contest. Take two middleweights whose physical statistics stack up evenly. Viewing both individuals would not, in this example, suggest one was stronger than the other. That is until they arm wrestle. In this contest person A easily beats person B. If A and B were stocks, the result of this contest would suggest you buy A over B. Nothing says in the long term that B cannot get a gym membership and ultimately build more strength than A. The point is we can easily check the relative strength any second we wish by clicking the mouse of a computer that is programmed to do the simple calculation.”
One Important Calculation
One important relative strength calculation I use in the portfolio decision making process is the comparison between the Standard and Poor’s 500 (S&P 500) and the Money Market. The Money Market is a benchmark for cash and the S&P 500 is generally acknowledged as the yardstick for the stock market. Generally, these two investments are negatively correlated. When one goes up in price, the other goes down. This calculation has only changed four times in the past 11 years.
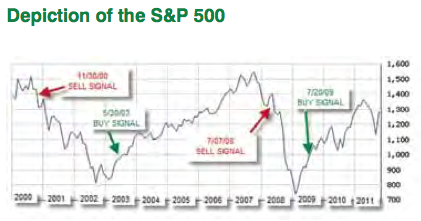
The chart below is a depiction of the S&P 500 with the four changes and the relationship change. A buy signal indicates the relationship between the Money Market and S&P 500, favors owning stocks. (An offensive position.) A sell signal suggests the Money Market is favored. (A defensive position.) This relationship is going to be after the peak or valley of a major market cycle.

When Relative Strength Talks, Listen
Let’s do some quick math with a hypothetical $100,000 investment. If you used the above S&P 500/Money Market relationship as your guide, on November 30, 2000, your last line of defense was breached. You sold your stocks or stock mutual funds and waited out the downturn by parking yourself in the Money Market. You would have been pleasantly sitting in cash and avoided 9/11 and the mayhem in the market that followed.
On May 30, 2003, the relative strength indicator advised you it was safe to go back in the market where you remained until July 7, 2008. Your $100,000 has grown to $137,675. At this time the relative strength indicator pivots to a defensive posture and you withdraw to the sanctuary of the Money Market. Once again sidestepping the worldwide market meltdown, where some investors lost 50 percent or more. After the bottom of the market in March of 2009, the indicator (July 20, 2009) once again changes posture and you redeploy your assets into the market.
As of October 28, 2011, just by reacting to the relative strength relationship of stocks to cash your nest egg today is valued at $186,948, a gain of over 86 percent.
In contrast if you applied the “buy and hold” philosophy most advisors advocate, your nest egg is close to your original $100,000 investment, excluding inflation. If you hit the panic button in either 2002 or 2008 without a blueprint to return to the market, you are way behind.
Tip of the Iceberg
The relative strength comparison between the Standard and Poor’s 500 and the Money Market is only the tip of the iceberg with respect how you can use the “silver bullet” of relative strength in your investment decision-making process.
If you used relative strength to compare asset classes you would have participated in the rise of commodities or the blockbuster growth of the emerging markets or even held fixed income in 2002 and 2008.
In summary, relative strength can help you improve performance, preserve capital and eliminate the pain, frustration and emotionality of investing. Choose to ignore it at your own peril.


