As we roll into 2014, our theme for the U.S. Equity market is we are in a “Structural Bull Market.” This is a change from the past 12½ years. Since early 2001, I believed we were in a “Structural Fair Market.” In a Structural Fair Market there could be several periods where the stock market can run up 20% and several periods where the stock market can drop 20%. And when the dust settles — you’re usually right back where you started. And that’s essentially what happened. Now we believe we have entered a Structural Bull Market. The last Structural Bull Market was from 1982-1999. During this time the U.S. Stock market moved up by more than 1000%. Yes, the market did have several sell-offs in 1987, 1990 and 1998. All were significant corrections.
My stance is not a prediction. We leave that to the pundits on television or the economist at trade association conferences. In September of 2013 at an Association Conference where I was a speaker, one leading economist (the keynote speaker) predicted a U.S. Stock Market crash of 15-30% within 3-9 months. He may be right or wrong. But why doesn’t anybody hold these people accountable?
My stance is not based on seeing the future through a crystal ball but based upon the weight of the technical evidence.
Long-term Market Observations
- U.S. Equities have held the top position in our Asset Class Matrix for the past 2½ years. (A big difference to the prior 10 years.)
- A well-defined bullish trend is prevalent for every major U.S. equity benchmark.
- Most U.S. Equity benchmarks have established new all-time highs.
- Over the past 2½ years, 9 out of 10 U.S. large cap stocks are trading in a positive overall trend.
These observations are in stark contrast to the 2000-2009 market. During the 2000-2009 market period International Equities and Commodities were the leaders. International Equities held the top position in our Asset Class Matrix 51% of the time and Commodities 33%, U.S. Equities 4%, Fixed Income 4%, Currencies 6% and Cash 3%.
None of these observations represent a guarantee for future direction of the market anymore than my belief in 2001 that we were entering a Structural Fair Market guaranteed a decade of sluggishness. These observations are useful to help you remain open to the possibility that what we have witnessed in the past 2½ years may carry forward for the next few years. As always we will follow our indicators. When they change, we change. For today, the U.S. Equity market is in a strong uptrend, and possibly will remain so for a long time to come.
What to do?
Long-time readers know that I am a big fan of relative strength and sector rotation.
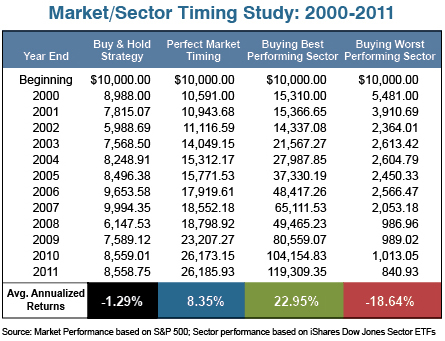
Just as produce in the supermarket rotates in and out of season, so do trends in the markets. There is a reason you feast on corn on the cob and fresh watermelon slices at your 4th of July picnic and have pumpkin pie for Thanksgiving. In your portfolios, you must be prepared to rotate as well. One example of the influence sector rotation can have on your portfolio is a hypothetical study. In this study, four different equity strategies were used: Buy and Hold, Perfect Market Timing (each year), Buying the Best Performing Sector (each year), and Buying the Worst Performing Sector (each year).
The first investor is Mrs. Buy and Hold. She just buys the Standard & Poor’s 500 and puts it in her safety deposit box and never makes a change. Our second investor, Mr. Perfect Market Timer is only invested in the S&P 500 when it has a positive return. Our last two investors are sector investors, one of which was clairvoyant enough to know each and every year what the best performing sector was going to be for the year, and subsequently placed 100% of their portfolio in that sector. The fourth investor was an unfortunate person as he managed to find the worst performing sector each year.
As you might imagine, each of the investors had markedly different results from their initial investment of $10,000 back in 2000. Mrs. Buy and Hold through 2011 shows a portfolio value of $8,558.78. Mr. Perfect Market Timer has a portfolio value of $26,185.93. Ms. Best Sector Timer has seen her portfolio grow to $119,309.38! All while Mr. Worst Performing Sector Timer’s portfolio plummeted to $840.93! To put it another way, the average annualized return for the Buy & Hold strategy since 2000 has been 1.29%, Mr. Perfect Market Timing is 8.38%, and it is an amazing 22.98% for Ms. Best Sector Timer. On the other side of the coin, the average annualized return for Mr. Worst Performing Sector Timer’s portfolio is a -18.64%.
Please keep in mind I am not recommending that you put all your money in one sector but rather it is just to show you the gap between the best and worst performing sectors each year and the opportunity present if you have and use the tools available to rotate between sectors.


