Manufacturers’ representative firms have a lot in common with Olympic rowers. Just to qualify to compete we have to be fast, agile and impressive performers.
But when it comes to line card profitability analysis, some of us forget what Olympic rowers know: To be winners, you have to take the boat out of the water regularly to clean and wax the bottom. And before the rowers get back in the boat, make sure that all of them really still belong on the team.
Instead of doing regular maintenance, we just row harder. Instead of replacing weak line card performers, we just row harder.
Rowing harder instead of solving the problems that drag down your representative firm’s performance is not a solution. It’s a certain way to lose races. And losing isn’t what gets us up in the morning, it’s what keeps us up at night.
So, let’s talk bluntly about how line card profitability analysis can keep your manufacturers’ representative firm operating at peak performance.
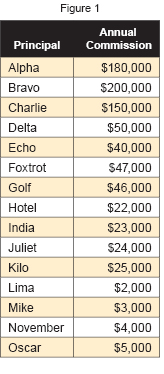
The first part of this blunt talk starts with the example of a representative firm that has 15 principals. That representative firm does not get one-fifteenth of its income from each of those 15 lines. Two or three of those principals often represent at least half that firm’s income. The rest of the firm’s income trickles in from the remaining 12 or 13 lines, which include some strong performers and some “not-strong” performers. See Figure 1.
 Regularly evaluating that mixed bag of 12 or 13 strong and “not-strong” performers to be sure that the right rowers are in your boat is what separates “world-class” manufacturers’ representatives who work smart and retire wealthy from “not-world-class” manufacturers’ representatives who must work too hard and barely keep their firms afloat.
How do we evaluate those 12 or 13 lines? Let’s look at the line card and commissions of a rep firm with 15 lines and $821,000 in annual income.
Based on income, this firm’s primary principals are Alpha, Bravo and Charlie. We will call the remaining principals secondary principals. Because it would be rare for a rep firm to drop one of its primary principals1, we will be ranking the secondary principals based on:
- How much income they bring in.
- How well they fit with the primary principals.
To rank the secondary principals based on how much income they bring in, we will create a chart that lets us plot each principal by income. The range on this chart is from zero to the largest income from any principal. In this example, the largest income from any principal is $50,000 from Delta.
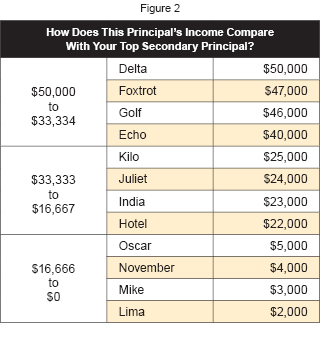 For clarity, in Figure 2 we break that zero to $50,000 range into three groups:
- $33,334 – $50,000
- $16,667 – $33,333
- $0 – $16,666
In the case of this example, ranking those secondary principals would appear as in Figure 2.
Of course, there is more to this analysis than just ranking our secondary principals by income. Manufacturers’ representatives thrive when they sell as many different principals’ products as possible to each of their customers. It just stands to reason that manufacturers’ representatives can sell more to a customer who can use products from 10 of that firm’s principals than to a customer who has use for products from only two of that firm’s principals.
So, a secondary principal with products that can be sold to all the customers of the firm’s primary principals has more potential than a secondary principal whose products can’t be sold to any of the firm’s customers for any of its primary principals.
With that in mind, in this example we also rank our secondary principals based on whether their products can be sold to customers of all three of our primary principals, two of our primary principals, just one of our primary principals, or none. See Figure 3.
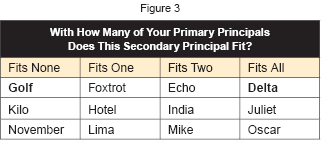 In this example, all other things being equal, Delta would be a more valuable principal for this representative firm than Golf, because every sales call for any of the firm’s top principals is also an opportunity to sell Delta. And any time the firm makes sales calls on behalf of Golf, it can’t sell any of the products of its primary principals, which should be that firm’s primary focus.
What Happens When a Principal is Not a Fit?
Fred launched his manufacturers’ representative firm to sell fasteners to Original Equipment Manufacturers (OEMs). Fred’s line card grew with screws, bolts, nails, staples, adhesives and tools used to mount fasteners. When Fred added his adhesive principal on his line card, that principal focused on bulk adhesives that were a great fit for Fred’s OEM customers.
Over time the adhesive principal discovered that its products were a better fit for the arts and crafts market than OEM market. They moved away from bulk packaged adhesives to blister packed consumer-sized packages, and asked Fred to start making calls on arts and crafts stores.
Fred made a few calls on arts and crafts stores, but he had no relationships with those stores’ decision makers and Fred’s business-to-business products were not a fit for business-to-consumer arts and crafts stores. Calls Fred made on arts and crafts stores were frustrating and unproductive.
It wasn’t Fred’s fault, and it wasn’t the principal’s fault. They had just grown apart over the years. Fred’s time is all he has to sell, and to be sure he is using his time productively, he resigned this adhesive principal’s line and focused his attention on principals with products that all his business-to-business customers could buy.
Let’s review the two factors that help manufacturers’ representatives do Line Card Profitability Analysis and decide whether or not a particular secondary principal belongs on their line cards:
- How much income they bring in.
- How well they fit with the primary lines.
Now, instead of ranking these two factors separately, let’s rank them together using a matrix (see Figure 4) where income is on the vertical axis and fit with primary principals is on the horizontal axis.
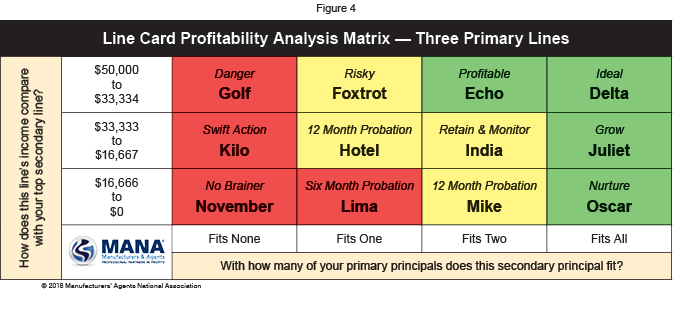 The principals that require review most urgently are in the red squares. Yellow squares should be reviewed next. Review of the green squares comes last.
Starting at the bottom left-hand corner, let’s look at what this matrix tells you about each of this manufacturers’ representative’s principals.
Principal: November
Annual Income: $4,000
Fit With Primary Principals: None
This principal brings in just $333 per month and every time the manufacturers’ representative firm calls on a customer to sell principal November’s products, that call can’t be leveraged to sell any of its primary principals’ products.
This principal costs the manufacturers’ representative firm much more to service than the commission income it brings in. It is a No Brainer for the manufacturers’ representative firm to resign this line.
Principal: Kilo
Annual Income: $25,000
Fit With Primary Principals: None
This principal brings in just over $2,000 per month but fits none of the representative firm’s primary lines. Based on the income, the representative firm will take a little time to be sure that this line won’t ever fit its primary lines, but will take Swift Action to avoid getting bogged down calling on prospects for Kilo products who can’t buy products from any of the firm’s primary principals.
Principal: Golf
Annual Income: $46,000
Fit With Primary Principals: None
This principal pays the manufacturers’ representative firm over $4,000 per month but has no product that fits the representative firm’s primary lines. Commission from Golf is in Danger because it is only a matter of time before the sales manager at Golf asks this question: “This representative firm focuses its primary attention in markets where my products can’t be sold. Shouldn’t I be looking for a representative firm that focuses on the markets where my products are sold?”
If nothing changes, it is likely only a matter of time before the principal makes the decision to end its relationship with this representative firm. Because this income is in Danger, the firm should either:
- Plan to replace this income with commission from principals who are a better fit for the firm’s other products, or;
- Look for other principals that are complementary to Golf’s products so Golf won’t be an orphan on the firm’s line card.
Principal: Lima
Annual Income: $2,000
Fit With Primary Principals: One
Because Lima brings in less than $200 per month and fits with one of the manufacturers’ representative’s primary lines, it is the last red square to be reviewed.
Yes, Lima does fit with one of the firm’s primary lines. But if there is little hope of significantly increasing Lima sales, current income from Lima is barely enough to cover the firm’s cost of a single Lima sales call per month. For that reason, Lima is put on Six Month Probation with the expectation that the firm will complete a more thorough review and probably resign as Lima’s representative.
Principal: Hotel
Annual Income: $22,000
Fit With Primary Principals: One
Principal: Mike
Annual Income: $3,000
Fit With Primary Principals: Two
Hotel and Mike both fall into the 12 Month Probation category. Neither need be addressed with the urgency of the categories previously discussed, but the reasons these two lack urgency are different.
Hotel commissions are nearly $2,000 per month and Hotel products can be sold with one of the primary principal’s products. Nonetheless, a case can be made that the firm would operate more efficiently if Hotel could be replaced with a principal with similar income but would be attractive to firm’s customers for two or three of its primary principals.
Mike commissions are just $250 per month. If there is little hope of significantly increasing Mike sales, that $250 barely covers the cost of a single Mike sales call each month. Mike also is put on 12 Month Probation with the expectation that the firm will complete a more thorough review and probably resign as Mike’s representative.
Principal: Foxtrot
Annual Income: $46,000
Fit With Primary Principals: One
Foxtrot brings nearly $4,000 of commission into the firm monthly, making it an attractive secondary principal to retain. But a secondary principal that fits with only one of the firm’s primary principals is Risky for the same reasons that Golf was Dangerous.
With customers for two of the representative firm’s three primary principals not being candidates for Foxtrot products, will some future Foxtrot sales manager say: “This representative firm focuses two-thirds of its attention in markets where my products can’t be sold. Shouldn’t I be looking for a representative firm that focuses fully on the market where my product is sold?”
The representative firm should keep that Risky status top-of-mind and be prepared to replace that income:
- If Foxtrot’s sales manager should decide to make a change, or;
- If the representative firm’s management decides that being responsible for a principal that can be sold only to one-third of the firm’s primary customers excessively drags on the representative firm’s productivity.
Principal: India
Annual Income: $23,000
Fit With Primary Principals: Two
India has the most going for it of any of the secondary principals discussed so far. It brings in nearly $2,000 in commissions monthly and is a good fit for customers of two out of three of the firm’s primary lines, so India’s category is Retain and Monitor.
The firm’s goal for India is to increase sales and commissions enough to move India into the box above it.
Principal: Echo
Annual Income: $47,000
Fit With Primary Principals: Two
Echo is a Profitable line. It brings in nearly $4,000 in monthly commission and is a fit for customers of two-thirds of the firm’s primary principals.
Principal: Oscar
Annual Income: $5,000
Fit With Primary Principals: All
Oscar is the first of the secondary principals in this review to fit with all three of the firm’s major principals, but it only brings in about $400 per month in commissions. A line with income that can hardly cover the cost of two sales calls a month has an obvious concern, but its great fit with the firm’s primary lines qualifies it as a line to Nurture.
The representative firm’s goal is to increase sales and commission so that Oscar can be moved into the box above it.
Principal: Juliet
Annual Income: $24,000
Fit With Primary Principals: All
With $2,000 per month in commission and a great fit with all the firm’s primary principals, Juliet is a principal to Grow so it can be moved into the box directly above it.
Principal: Delta
Annual Income: $50,000
Fit With Primary Principals: All
Delta is what the representative firm wants all its secondary principals to look like: Excellent income and a great fit with all the primary principals. The representative firm’s goal is to move all its secondary principals into the same box as Delta, and perhaps to move Delta up into a primary principal someday.
Now that we’ve done Line Card Profitability Analysis on our example representative firm, let’s look at the tools you’ll need to make this same analysis of your own representative firm’s secondary lines.
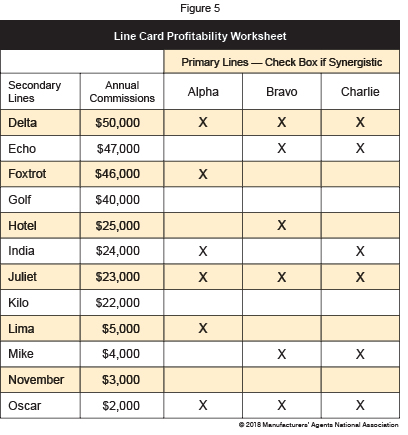 In our example, the representative firm doing the evaluation started by filling out this worksheet, see Figure 5. Primary lines Alpha, Bravo and Charlie went on the top row, and then data on the firm’s secondary lines was added to the rows below it. Now build your own chart for your manufacturers’ representative firm’s primary and secondary principals.
Then use the data sheet you’ve just created to place each of your secondary principals into the matrix shown in Figure 4. MANA members can also view a matrix for two or four primary principals in the member area of the MANA website, www.MANAonline.org.
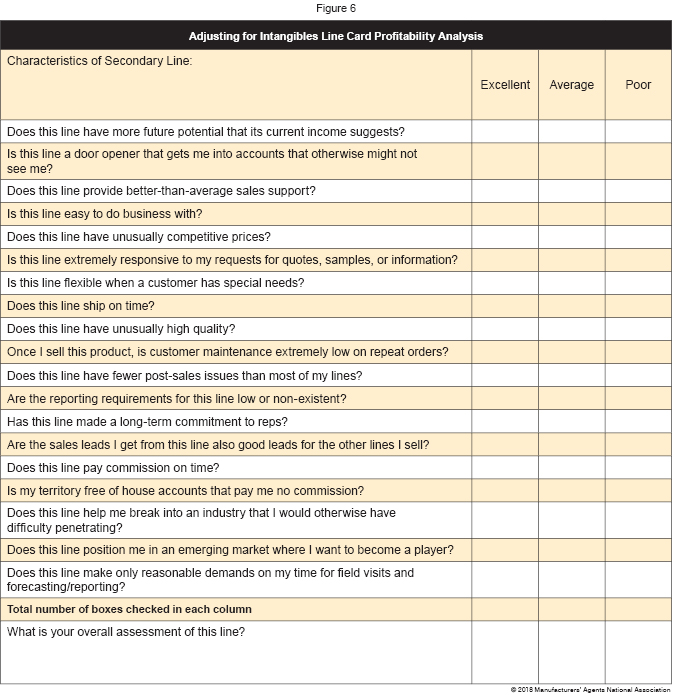
But there is more to a secondary principal than just how well its products fit with your primary lines and its current commission income. Before you make your final decision, fill out the questionnaire (Figure 6) for each secondary line and include the intangibles in your decision.
 Once you have completed Line Card Profitability Analysis for all the secondary principals on your line card, you are like the Olympic rower who has pulled her boat out of the water to clean and wax its hull. You have started the process of managing your firm so its sales force can work at peak efficiency.
The hardest part of this analysis is acting on your findings. You will find that some of your principals are a good fit for your firm, and focusing your attention on those principals will give you maximum efficiency and income. And you will also find that some of your principals are a drag on your firm’s efficiency and performance and don’t belong on your line card.
It’s not easy to resign a principal, even if that principal is holding your firm back. But as a manager it’s your job to make the hard choices. We hope that by giving you a process to follow that you now have the tools you need to make those hard choices correctly, so you can focus on the things that get you out of bed in the morning instead of the things that keep you up at night.
MANA members can visit the member area of the MANA website, www.MANAonline.org, for more blank forms and examples.
MANA welcomes your comments on this article. Write to us at [email protected].
1 This article discusses the process of Line Card Profitability Analysis for the secondary lines in a manufacturers’ representative firm. If one of the firm’s primary principals is a mismatch for the rest of the firm’s line card, many firms will choose to launch a new division around that primary line and build a new line card of secondary principals around it, which is outside the scope of this article.


