This is the fifth in a number of articles serializing The Sales Force — Working With Reps by Charles Cohon, MANA’s president and CEO. The entire book may be found in the member area of MANA’s website.
When Harold arrived in the conference room carrying a coffee cake, Jim was relieved. The mood as their last meeting ended had seemed a bit tense, but the pastry told Jim that Harold either hadn’t noticed or wasn’t carrying a grudge. Harold set the coffee cake on the conference table, and before he even sat down began slicing it with a plastic knife.
Harold dropped into a chair at the head of the table and they exchanged pleasantries for a couple of minutes. Then Harold carefully set on the table a sheaf of hand-written notes so thick that Jim could tell the meeting probably would last all morning. Harold began to speak.
“Jim, when it comes to applying statistics to business problems, most of the books I’ve read and the experience I’ve had apply them to operations and manufacturing issues, so the only examples I have readily available to explain this topic are from operations and manufacturing. I promise you we’ll get to how this fits with our sales force compensation problems, but please bear with me even if it looks like I am headed off on a tangent during the first part of this discussion.”
Jim’s nod gave assent, so Harold continued. “What I want to talk about today is the difference between results that are a part of a system and results that are an indication of a special case. What I mean by a system is a group whose members cannot be distinguished from each other by their results.” Jim shifted uncomfortably in his chair, and a quizzical look passed over his face. Harold noticed and decided to illustrate his point with a simple example.
“To explain what I mean by a system, let’s take a typical example from the shop. Say I have three workers in the shop drilling holes. On Monday, George drills 290 holes, Dominique drills 300 holes and Sam drills 310. Is Sam a better driller than George?”
Jim nodded, “Sure.”
Harold shook his head slightly, “Actually, we really don’t know. When you think about it, each of the three is pretty close. When results are this close, we say that George, Dominique and Sam are part of a system. On any given day we could expect George to be number one, number two, or number three — same for Dominique and same for Sam. If the differences among them are so small that they can only be attributed to random variables outside George’s, Dominique’s or Sam’s control, they are not far enough apart for the variances to be considered significant numbers. So when you look at the group and say that the numbers for George, Dominique and Sam don’t give us any indication that one is outperforming the others, you are saying that George, Dominique and Sam are inside the system.”
At this point, Jim interrupted Harold. “Maybe so, but shouldn’t we pay Sam the most, at least for Monday? After all, he made the most holes.”
“We could,” said Harold, “but let’s look at what we would be rewarding. Why are we paying Sam more? Did he work smarter than George and Dominique? Did he work harder? If we maintain that all three are within a system and that the one who drills the most holes does so for reasons completely beyond his or her control, then we are saying that something other than brains or effort made Sam number one on Monday.
“Maybe Sam got freshly sharpened drills that morning and the others didn’t. Maybe Sam got material that was just slightly softer and easier to drill than the others. Or maybe that day when George ran out of material to drill and went to the storeroom for more, he saw Sam was running low and brought enough for Sam too. If the three are part of a system, we are saying that the difference in their efforts and effectiveness is insignificant statistically and the value of their labor is indistinguishable to the company.
“If we make the mistake of rewarding an outcome even when the contributions effectively were equal, the payoff becomes a lottery,” continued Harold, “And what would happen if we did? George, Sam and Dominique would fight over the sharpest drills and the softest material. And would George ever take the time to see if Sam needed more raw material? No way.” The wheels were starting to turn for Jim, and he found himself nodding in agreement.
“Now that you mention it, I’ve seen stuff like this happen with the outside salespeople,” Jim offered. “Except in sales if three salespeople each turned in an order to the manager, one for $290, one for $300 and one for $310, the one who sold $310 is the hero and the one who sold $290 is the goat. And, of course, because we pay our salespeople on commission, whoever sells the most takes home the most pay. And you’re right, salespeople do fight over the ‘sharpest drills’ and ‘softest material,’ and they don’t give each other any kind of help. Even so, with outside salespeople you have to pay them on commission or they’d spend their afternoons at the movies instead of selling,” Jim said emphatically. “You’re lucky that your shop workers have to be on the shop floor where they can’t hide instead of driving around in company cars.”
“You make sales management sound like dropping a food pellet to a mouse so it will run a maze,” countered Harold as he reined in the more critical comments that came to mind. “But let’s come back to the sales issues a little later. Now that we’ve discussed employees who are within a system, we need to discuss the employees whose outcomes aren’t within the system. These are called ‘special cases.’ Star employees who dramatically outperform the average employee are ‘special cases,’ but the employees who are very far below the average are ‘special cases’ too. ‘Special case’ just means that the employee’s output is so far above or below average that it gives us statistical proof that the individual’s skill, work ethic or abilities are the source of the difference.
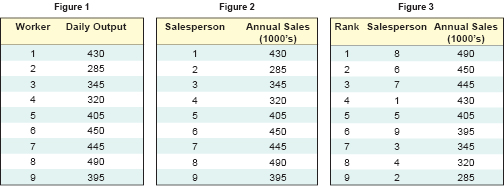
“I will keep the statistics and math to a minimum, but a certain amount is unavoidable,” admitted Harold. “I absolutely will guarantee that once you get through this little bit of math, you will be very glad that you did.” He opened Scherkenbach’s book1 and said, “I am going to refer to this book to keep my explanation on track, but I will need to alter the examples a bit. The book is based on examples that track employees’ mistakes. Tracking employees’ successes illustrates special cases just as well as tracking their mistakes, and will translate better when you go to work on sales problems, because in a sales environment you concentrate on number of wins just like we look at the quantity of goods we manufacture. Let’s look at the output of nine workers in the factory.” (See Figure 1.)
“Wait a minute,” said Jim. “As long as we’re looking at a sales problem, couldn’t we call these nine salespeople and call the output their annual sales?”
“OK, Jim,” Harold said, “let’s go ahead and do it that way, but we should do a little more than just change the headings. In the plant, we look at a daily cycle, because any one manufacturing employee’s input into our product can easily be completed in a day. I know that salespeople don’t go from sales lead to closed sale in a day, so a one-day cycle would be too short.”
“Darned right,” Jim piped up. “When we receive a sales lead, we spend quite a bit of time trying to convince the engineer that our parts are superior. Once that is done, we have to wait to sell our flanges until the engineer’s next project goes from drawing board to manufacturing. With everything we have to go through, our sales cycle is about a year.”
“Then a year is the period that is statistically significant,” Harold replied, “so we will use annual sales in our example. (See Figure 2.)
“Now that we’ve got their annual sales, the next logical step is to rank the salespeople,” said Harold. (See Figure 3.)
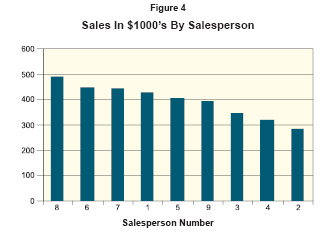
“As Scherkenbach points out, looking at the data graphically makes it much more understandable than a table, so let’s do that next. (See Figure 4.)
“Clearly, salesperson #2 has committed the unforgivable sin of coming in dead last,” Harold continued. “As a matter of fact, salespeople #9, #3, #4 and #2 all are in the bottom half of the sales force, and probably would be removed by a tough manager. Scherkenbach points out the error of this typical evaluation: ‘We knew from the start that one of the nine employees would be in the top 11 percent and one would be in the bottom 11 percent (1/9 = 11.11 percent). We knew that before we gathered any data. What we need to know is whether or not the top or bottom 11 percent are part of the system, and if they are not, and thus in need of different treatment.’
“Here is where the math and statistics come in, but I am going to hold it to a minimum. A standard way statisticians measure how far one number of a group of numbers deviates from the average of the group is called a standard deviation. This is a very important concept, because the standard deviation lets us figure out which workers are within the system and which are special cases. A spreadsheet program like Excel™ will calculate standard deviations for you from the formula =STDEV(First Cell:Last Cell).
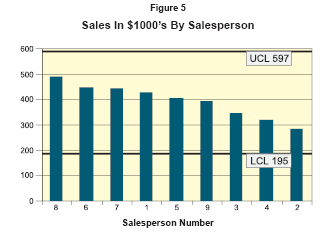
 “In our example, the standard deviation is 67. Statistical rules tell us that any results within three standard deviations of the average are within the system rather than a special case. By that I mean you start by multiplying the standard deviation by three. In this example, three times the standard deviation is three times 67, or 201. Any result that is within 201 of the average is a part of the system, not a special case. The average in our example is 396. Subtracting 201 from 396 gives us a lower limit of 195 and adding 201 to 396 gives us an upper limit of 597. The number 195 is referred to as a Lower Control Limit (LCL) and 597 is called an Upper Control Limit (UCL). (See Figure 5.)
“What the graph tells us is that the results of all of the salespeople are between the LCL and UCL. That means that the differences in their results are attributed to factors other than the individuals’ performance,” explained Harold.
“I just can’t accept that, Harold,” said Jim. “You are trying to tell me that there is no difference between a salesperson who sells $285,000 and a salesperson who sells $490,000.”
“Not to split hairs, Jim,” said Harold, “but that is not exactly what I said. There can be all kinds of differences between them, but what I am trying to get across is that when you take a statistical look at these nine results, the numbers do not provide any statistical evidence that any one salesperson did a better job than the others.
“The salesperson who sold $490,000 ‘got the sharper drills’ and the one who sold $285,000 got ‘material that was harder to drill,’” continued Harold. “All kinds of factors influence sales. For instance, sometimes we have stock when your customer calls, and sometimes we don’t. Sometimes our best customer service person answers your customer’s call and sometimes our worst one answers. Sometimes the differences between our products and our competitors’ products work for you, sometimes they work against you. Sometimes a customer wants a product with a UL label, and sometimes the customer wants a product that carries the European equivalent of UL approval. These are things that are part of the system, and the salesperson has little or no influence over them.”
Jim could have accepted that argument if the range of numbers had not been so great. “Are you saying if we took this set of numbers back into the factory, you would treat someone who produced 285 pieces a day the same way you would treat someone who built 490 pieces a day?”
“Absolutely,” said Harold, “and any factory run with statistical precision anywhere in the world would do the same thing.”
“So,” Jim countered, “if Deming’s statistical systems say that anything from 285 to 490 pieces is OK and Deming is such a big deal in Japan, how come I hear so much about the consistency of Japanese manufacturing concerns?”
Harold tented his fingers in front of his face, resting the tip of his nose on his index fingers as he gave Jim’s question some thought. “Actually, Jim, you’re right. A range of 285 pieces to 490 pieces is not OK. I am not saying that it is. What I am saying is that, statistically, any output between 195 and 597 is a part of the system and when the outputs are in that range they do not provide any evidence of the quality of work of any individual worker.
“The system we are using in our example exists due to a variety of factors that are within the control of management but are outside the control of any individual worker. For example, if we always had stock, the numbers would cluster closer together. If we didn’t run out of literature, the numbers would cluster closer together. If every one of our customer service reps was well-trained, polite and super-responsive, the numbers would cluster closer together. If we answered every call by the third ring instead of dumping calls into voice mail during peak periods, the numbers would cluster closer together.
“Management can do the things that have to be done to make the standard deviation smaller and to move the average higher, but there is nothing one single salesperson can do about those things. As long as the salesperson works in an environment where so many variables outside his or her control determine the outcome, I will repeat that, yes, there is no reason to treat any salesperson differently from any other as long as both have sales between $195,000 and $597,000.”
“Look, Harold, I appreciate what you are telling me, but this is exactly the opposite of everything I’ve ever heard about sales. Frankly, I’m pretty sure there is a hole in that argument somewhere if I knew enough math to figure it out.”
Harold put his elbows on the table and rubbed his temples before replying. “Jim, I’ve been using control charts like this to run my manufacturing operations for 25 years and I have to tell you I absolutely stake my reputation on the science of statistics and the importance of identifying which outputs are part of systems and which are special cases. And, now that you bring it up, I realize that nobody ever went broke underestimating the American people’s lack of understanding of probability distributions and statistics.”
Jim bristled at Harold’s suggestion that his intuition was inferior to Harold’s statistical background. “Harold, what exactly do you mean by that?”
“I remember that you went to Las Vegas last year,” Harold explained. “Do you remember the vast scale of the buildings and how much new construction was going on?” Jim nodded. “Where do you think all the money came from? From tourists. Casinos that are very sophisticated about probability distributions and statistics took that money from tourists who were not. The casinos can’t tell you what will happen on the next roll of the dice, but it’s a sure thing they can tell you exactly what will happen when the dice are rolled a million times.”
“Harold, I am going to be very direct with you. If I knew more about math I might completely buy into your argument or I might come up with a brilliant rebuttal to prove you’re all wet. As far as I can follow your arguments, I can’t find any holes in what you said, but my gut tells me there is a hole in there somewhere that I just can’t put my finger on. Honestly, no matter how much math you throw at me, the best you’re ever going to do is to get me to accept your logic intellectually without really believing it in my gut.”
“Point well taken, Jim,” said Harold. “Let me see what I can come up with and I’ll get back to you. Let’s get together the same time next week and we’ll see if I can’t come up with an example that is a little less academic and a little more real-world.”
To be continued next month.
MANA welcomes your comments on this article. Write to us at [email protected].


