This is the sixth in a number of articles serializing The Sales Force — Working With Reps by Charles Cohon, MANA’s president and CEO. The entire book may be found in the member area of MANA’s website.
People eating lunch in Bigglie’s break room tended to spread out one per table until all of the tables were full. By the time Henry Buchanan walked in to wait for his brother David to be ready to go to lunch no empty tables were left, so he had to sit with somebody. Henry recognized Jim from the company’s Christmas party, and gestured to a seat at Jim’s table, “OK if I join you?”
“Sure, have a seat,” Jim replied. A little P.R. with the boss’ brother couldn’t hurt, he thought. “I’m Jim Anderson. We met at the Christmas party. You’re Henry, right?”
“You salespeople are really good with names,” Henry replied.
Jim warmed to the compliment. “Thanks, Henry. It’s an important part of the job. You do something in insurance, don’t you?”
“I’m an actuary,” said Henry. “My job is to decide when two things have an equal value.”
Jim’s eyebrows furrowed, which Henry interpreted as a signal for explanation. “Let’s say my insurance company has three envelopes in a hat. We offer to sell you and two other people the right to pull out a single envelope and keep the contents. Nobody gets to open his or her envelope until all three of you have made a selection. One envelope has $40,000 in it, one has $50,000 and the last one has $60,000. As an actuary, my job is to determine what to charge each of you for an envelope. In this case, pulling all three envelopes from the hat would get you $150,000, so the actuarially fair price for an envelope is $50,000. An insurance company adds its profit to that actuarially fair price, so we might charge $51,000 per envelope and make a $3,000 profit.”
Jim nodded his understanding, so Henry continued. “What I do is use statistics to evaluate complicated combinations of hats and envelopes. For life insurance, let’s take a group of 100 people. If the characteristics of this group tell me that I can expect one of them to die this year, and the policies I’m selling pay $100,000 to the surviving spouse, I would have to charge $1,000 per policy to break even. Give me a group of 100 people, and I can give you a fairly good estimate of how many are going to die this year.”
There was something about Henry’s description that made Jim flash back to Harold’s comments about statistics. Normally, Jim would have found a way to change the topic, but there was a common thread nagging at him, so he let Henry continue.
“In a group of 1,000 we can predict mortality rates much more accurately than we could in the group of 100, and in a sample of a million people we have outstanding accuracy. Of course, I can’t tell you which people in a group of a million will die, but we get so close to the actual number, it can seem a little creepy.”
A tiny voice told Jim that something about Henry’s comments was important, but he’d heard enough about statistics for one lunch hour and was grateful when David Buchanan’s voice came over the paging system to summon his brother to lunch. Jim remembered that Harold had mentioned Las Vegas as evidence of the power of statistics. “Well,” thought Jim, “maybe it’s just another example how businesses that understand statistics make big money,” but he felt as though some larger truth was lurking there, just beyond his reach. Returning his attention to his lunch, he decided that he didn’t mind when statistics lessons appeared unexpectedly, as long as they arrived in small bites.
One Week Later
A week to consider Harold’s position hadn’t brought Jim any closer to accepting it. In fact, the carefully organized arguments Harold made last Wednesday had gotten jumbled in Jim’s head, and Jim wasn’t really sure why he had considered letting Harold’s logic overrule his instincts. On his way to see Harold he resolved to stand behind his instincts more firmly. As he walked into Harold’s office, Jim saw Harold had a big smile on his face and a curious collection of items on his desk — three miniature wooden oars that looked like oversized ping pong paddles and a dishpan-sized open-top container of white and red marbles.
Jim walked over to the desk and hefted one of the paddles. “So, Harold, am I in for a spanking?”
Harold chuckled. “Well, Jim, I don’t think there is any reason to give you a spanking, but I may just spank some of your old assumptions about sales quotas with that real-world example you asked for last week.”
Jim noticed a matrix of five rows and 10 columns of marble-sized dimples on the paddles. “Harold, what do you have in mind, exactly?”
“I am borrowing this right from W. Edwards Deming,” said Harold. “He was famous for using paddles and marbles to illustrate his ideas, and I am going to adapt Deming’s example1 somewhat to illustrate my point. You were having trouble accepting that salespeople who worked equally hard and were equally smart could have significantly different results. This will show that when you eliminate the effects of skill and hard work from the situation you still can get results that are just as far apart as the results we discussed last week.”
“What is this supposed to prove, Harold?”
“If I can show you that we can get very different results even when the effort and skill are exactly and precisely the same, then you should be able to genuinely embrace statistical thinking instead of just feeling that I bullied you into agreeing because you didn’t know enough math to fight back.”
“OK, what do we have here and what do you have in mind?” Jim asked.
“What we have here are 5,000 very well-mixed marbles — 2,500 white and 2,500 red. Let’s say when you draw a white marble, it means none of the things that prevent a sale from happening occurred, and in that case the salesperson always gets the sale. Drawing a red marble means something got in the salesperson’s way and the sale wasn’t possible — the customer service person was rude, or we were out of stock or we couldn’t match the competitors’ price.
“Each salesperson dips a paddle into the pile and draws out 50 marbles. We already have stipulated that all the salespeople are equally hard-working and smart, and the 50 dimples represent the 50 calls that are the most a salesperson can make in a given week. So let’s do an experiment and we’ll see how well they perform. To give everyone an exactly equal chance, we return the marbles to the bin and remix them after each pull, so each salesperson has exactly the same chance to pull out white marbles. And as long as it’s my experiment, I’m going to name the salespeople Hamilton, Jackson and Franklin, and the sales manager Grant. You get to dip the paddles to choose the marbles, and I’ll keep score — one for white and zero for red. So let’s see how our sales force did on their first week, shall we?”
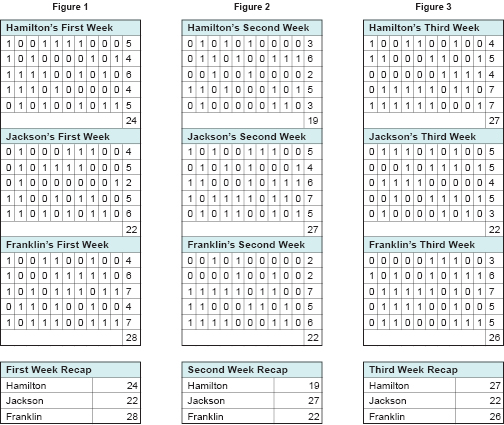
Jim dipped the marbles from the bin, and Harold recorded the results on a chart. (Figure 1.)
“Grant interprets these numbers without understanding statistics,” says Harold. “In Grant’s words: ‘Looks like Hamilton didn’t quite hit his target and Jackson is in a bit of trouble, but it’s bonus time for Franklin!’”
Jim stirred the marbles from his first pick back into the bin, and then dipped each paddle into the marbles again. Harold charted the results again. (Figure 2.)
“How would Grant read these numbers?” asked Harold. “Probably like this: ‘We weren’t hard enough on Hamilton when he came up short at 24 sales last week, and it shows in the miserable 19 that he turned in this week. Jackson, on the other hand, really responded to the chewing out we gave him. He’s the star of the week at 27. Franklin is a disappointment at 22. He must have spent the bonus from Week One on beer.’”
They did a third repetition of the experiment. (Figure 3.)
“Grant is ready with his evaluation at the end of week three,” continued Harold.
“This just shows what Hamilton can accomplish when he puts his mind to it,” says Grant. “We spent a lot of time with him after the abysmal 19 sales he made last week, and it really paid off. We shouldn’t have neglected Jackson, as we can see that the lack of nagging resulted in his dropping down to 22 units. Franklin apparently is getting the idea — at least he is over 50 percent.”
Once again, they recycled the marbles and created a new chart.
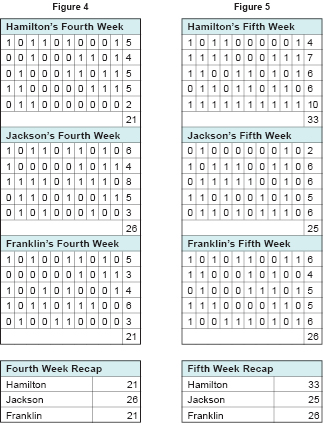
 “Grant is disappointed with week four,” said Harold. “‘Hamilton and Franklin are both a problem at 21,’ says Grant, ‘which is only 84 percent of the 25 that they should be getting based on 50 percent white marbles.’” (Figure 4.)
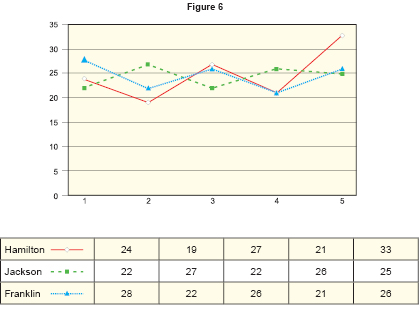
Harold charted the final repetition. (Figure 5.) “Grant is ready to crow now,” said Harold. “‘Thanks to my tireless sales management,’ gloats Grant, ‘Hamilton set a new company record at 33 sales in one week, Jackson is at least at 50 percent and Franklin is over 50 percent. Based on these outstanding results, my skills as a sales manager are clearly documented. This would be a good time to chart the results (Figure 6), revise my résumé to reflect my success as a manager and submit it to other companies.’”
 Harold grinned at Jim. “So Jim, here we sit with results that came from your dipping paddles into a pan of marbles, but we see exactly the same kind of differences in sales numbers that Bigglie uses to assign rewards and punishments every month. If we can’t use these numbers to tell that the ‘Hamilton’ paddle somehow is more talented or harder working than the other two paddles, why do we use similar numbers to reward and punish real-life salespeople?” asked Harold. “Yet on a commission basis, Hamilton is paid more, but doesn’t know why or how to continue his success. Franklin and Jackson get less than Hamilton, but, compared to Hamilton, have they done any more or any less for the company? They make less than Hamilton but can’t figure out what to do to follow Hamilton’s example.
“How does it benefit the company to have each salesperson confused about what they need to do to succeed? Have you ever heard what happens when you randomly reward and punish lab animals in such a way that they can’t figure out how to get the reward or avoid the punishment? They go nuts. It can’t be any healthier for our salespeople.”
To be continued next month.
1 W. Edwards Deming, Out of the Crisis (Cambridge, MA: Massachusetts Institute of Technology, Center for Advanced Engineering Study, 1982) p. 346–354.
MANA welcomes your comments on this article. Write to us at [email protected].


